
Modify forms and views
In the Innovation Challenge sample app, the first row of tiles in the dashboard, as shown in the previous figure, contains two charts called Active Challenges and a list called Active Ideas. The configuration of the entity assets for Challenge and Idea rows in the App Designer are what make the data from those entities appear as they do.
For example, in the App Designer interface for this app, the Challenge entity has a number 2 in its Charts asset box. Selecting that box displays the Select Charts interface in the Components pane, as shown in Figure 4-50. The two check boxes selected are Active Challenges by Domain and Most popular Challenges, which, not coincidentally, are the two charts that appear in the Innovation Challenge dashboard.
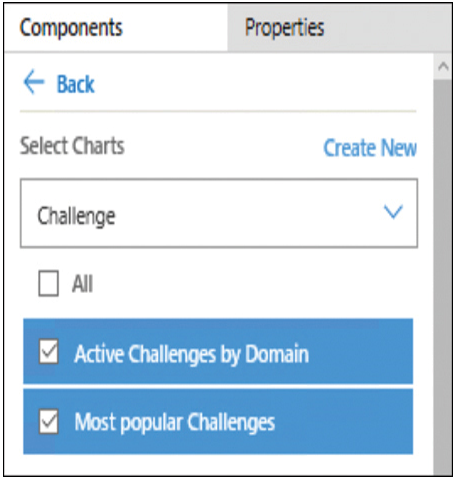
FIGURE 4-50 The Select Charts interface in the Components pane of a model-driven app
Clicking the down arrow in the Charts asset box opens a drop-down list with the names of the two charts, each with an edit icon that opens the Chart Designer window, as shown in Figure 4-51. In this window, the developer can change the appearance of the chart by selecting a chart type and configuring its properties.
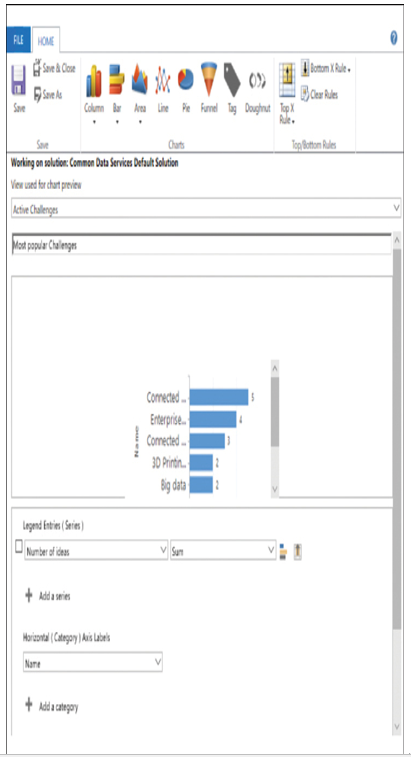
FIGURE 4-51 The Power Apps Chart Designer interface
Forms appear in model-driven apps when users view entity data in a table format and click the New button to create a new record in the entity. For example, selecting the Challenges screen in the Innovation Challenge app and creating a new record displays the form shown in Figure 4-52, which is similar in appearance to a business process flow in Power Automate, taking the user through multiple stages, beginning with Setup, with several steps to complete in each stage.
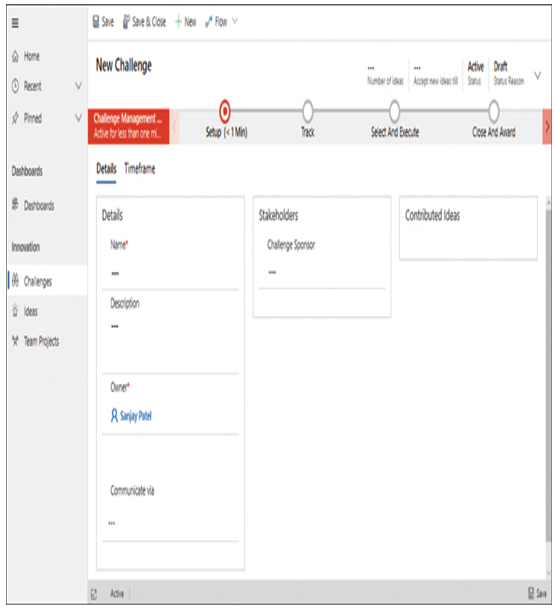
FIGURE 4-52 The New Challenge form in a model-driven app
As with the Charts asset box, the Forms asset box provides an edit button for each of the forms appearing in the drop-down list. The edit button opens the Form Editor interface, as shown in Figure 4-53. The Form Editor has a WYSIWYG display of the form in the center pane. In the left pane, the developer selects the fields that will appear in the form, and the right pane contains the configurable properties for the selected field. After modifying the form, the developer must save the changes and publish the form so that it can appear in the live app.

FIGURE 4-53 The Power Apps Form Editor interface
A view in a model-driven app is a display of information from the Common Data Services database in tabular form, as shown in Figure 4-54. Views can also appear on dashboards as scrollable lists, as shown earlier.
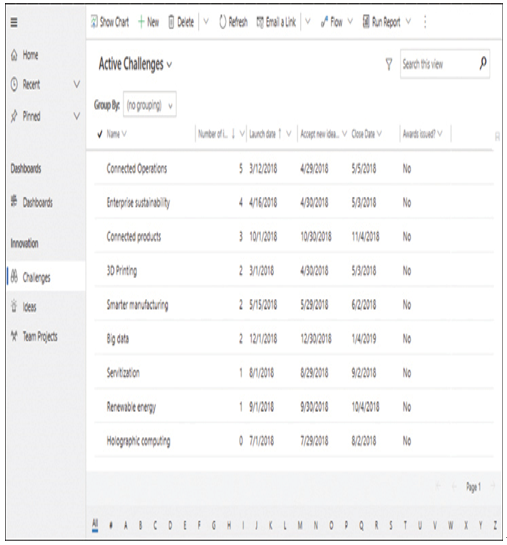
FIGURE 4-54 A view page in a model-driven app
Developers can modify views from the entity asset boxes just as they can charts and forms. The View Editor interface, shown in Figure 4-55, is similar to the Form Editor, with selectable fields listed in the left pane, editable properties in the right pane, and a real-time display of the view in the center pane, to which the developer can add and remove columns.
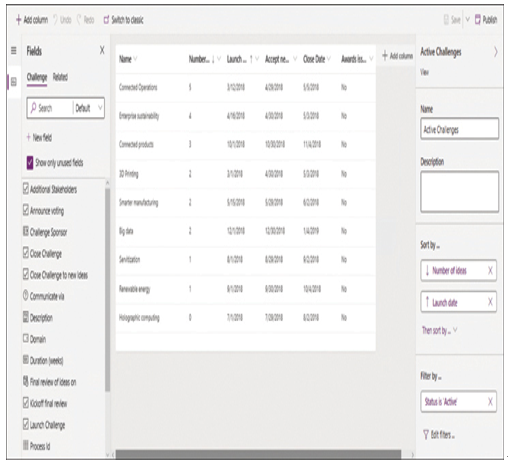
FIGURE 4-55 The View Editor interface in a model-driven app
Exam Tip
Candidates for the PL-900 exam should be aware that all the designer interfaces for the entity assets have been updated recently, and the new versions—called the new experience—are now the defaults. However, many of the documents and resources online are still based on the previous interfaces. All of the designers also have a Switch to classic button that allows developers to use the previous interface.